I am a final-year Master of Information Technology student at the University of Melbourne, focused on building web applications that make large datasets understandable.

My work sits where full-stack engineering meets data visualization: I clean and transform public datasets in Python, then turn them into interactive interfaces in React and TypeScript that people can actually explore.

I am currently looking for a web development or data visualization internship in Melbourne. If you are hiring, my resume has the full details.

About Me

  • Engineering

    Full-stack delivery across React 19, Vite, and Node.js REST APIs — including a legacy Vue frontend I refactored into a feature-modular React codebase.

  • Data

    Reproducible Python pipelines for spatial, clinical, and image datasets — cohort definition in BigQuery, cleaning and imputation in pandas, and model-ready outputs.

  • Delivery

    Agile collaboration with an emphasis on documentation: release notes, test evidence, and technical specs that let a team pick the work up without me in the room.

Projects

Selected work across full-stack development, spatial visualization, and applied machine learning.

Placeholder graphic for the LevelLens assessment review platform

LevelLens Assessment Review Platform

Full-stack platform for reviewing and comparing exam submissions

Full-stack Developer · Documentation & Project CoordinatorMar 2026 – Jun 2026

A review platform for assessment teams, covering submission review, exam version comparison, report navigation, and rule-based suggestion generation.

  • Built and integrated backend REST API endpoints powering the core review workflows — submission review, exam version comparison, report navigation, and rule-based suggestions.
  • Refactored the frontend from a legacy Vue implementation to React 19 + Vite, restructuring pages into feature-based modules and reusable UI components.
  • Owned technical documentation, release notes, and test evidence across the team's GitHub workflow.
  • React 19
  • Vite
  • TypeScript
  • Node.js
  • REST API
  • GitHub
Placeholder graphic for the Urban Tree Cover Explorer mapping platform

Urban Tree Cover Explorer

Interactive spatial visualization of the Melbourne Urban Forest

Spatial Data Visualization & Interactive MappingMar 2025 – Jun 2025

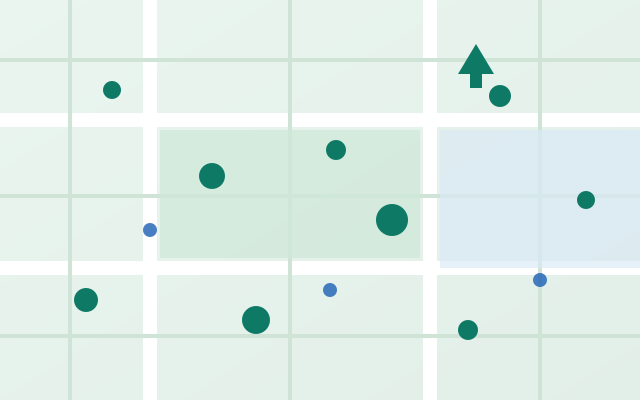
A map-based explorer for the City of Melbourne Urban Forest dataset, supporting search across tree locations, species groups, maturity status, and nearby landmarks.

  • Automated a Python pipeline that cleans, transforms, and converts 82,064 spatial records into map-ready marker data, removing the manual preparation step entirely.
  • Designed custom SVG map markers per tree category to keep a dense, large-scale dataset legible.
  • Implemented spatial filtering and querying by distance, species, and maturity status for location-based analysis.
  • Added user-generated markers for significant locations to support interactive trip planning.
  • Python
  • Pandas
  • WordPress
  • WP Go Maps
  • SVG
  • Geospatial
Placeholder graphic for the AKI mortality prediction project

AKI Mortality Prediction Using MIMIC-IV

Clinical cohort construction and preprocessing at ICU scale

Clinical Data Preprocessing · Machine LearningAcademic Project

An end-to-end preprocessing pipeline for predicting mortality in acute kidney injury patients, built on the MIMIC-IV critical care database.

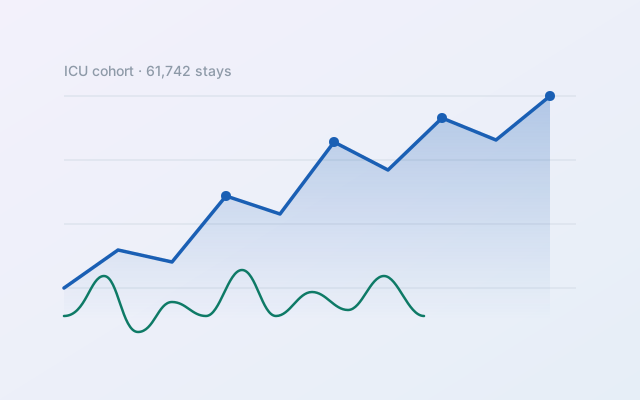
  • Defined an AKI cohort in BigQuery, joining ICU stay details, KDIGO AKI stages, severity scores, labs, vital signs, blood gas values, and comorbidities.
  • Built a reproducible Python pipeline covering cohort cleaning, missing-value imputation, outlier handling, log transformation, normalization, and categorical encoding.
  • Analyzed 61,742 ICU stays with exploratory data analysis, correlation analysis, and principal component analysis.
  • BigQuery
  • SQL
  • Python
  • Pandas
  • NumPy
  • PCA
Placeholder graphic for the Nutrition5K calorie estimation project

Nutrition5K Calorie Estimation Model

RGB-D fusion for food calorie estimation

Computer Vision & Data ProcessingAcademic Project

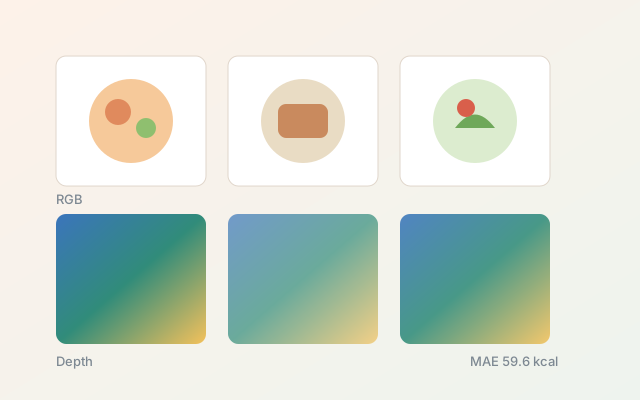
A PyTorch pipeline that estimates the calorie content of a meal from paired colour and depth imagery.

  • Built a preprocessing pipeline for 3,086 RGB-D food image records, covering loading, augmentation, label normalization, and model preparation.
  • Automated an 80/20 train–validation split so experiments stay reproducible across runs.
  • Evaluated RGB against RGB-D models; the final fusion model improved validation MAE from 69.7 kcal to 59.6 kcal.
  • PyTorch
  • Python
  • Computer Vision
  • RGB-D
  • Data Augmentation

Skills

Programming
  • Python
  • JavaScript
  • TypeScript
  • Java
  • SQL
  • HTML
  • CSS
Data Analysis & Spatial Visualization
  • Pandas
  • NumPy
  • Data Cleaning
  • Exploratory Data Analysis
  • Interactive Mapping
  • WP Go Maps
Frontend
  • React
  • Vite
  • Tailwind CSS
  • WordPress
  • Responsive UI Design
  • SVG Graphics
Backend & Database
  • Node.js
  • REST APIs
  • Django / Flask basics
  • MySQL
  • PostgreSQL
  • BigQuery
Tools & Workflow
  • Git
  • GitHub
  • Jupyter Notebook
  • Microsoft Excel
  • Agile Collaboration
  • Technical Documentation

Education

  • The University of Melbourne

    Jul 2024 – Present

    Master of Information Technology

    Melbourne, VIC

    • Coursework across software engineering, data systems, machine learning, and spatial information.

Interests

  • Outdoors & water

    Free diving, scuba diving, snorkeling, swimming, camping, and both crab and river fishing.

  • Sport & kitchen

    Badminton and table tennis, plus a standing weekend habit of cooking and baking.

Contact

I am looking for a 2026 web development or data visualization internship in Melbourne, and I am happy to talk about anything involving maps, datasets, or frontend architecture.